Fun with graphs in apycot
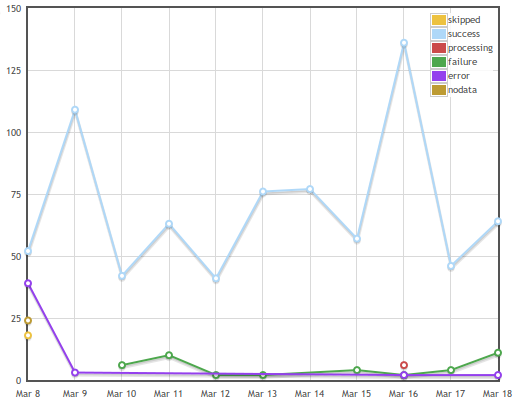
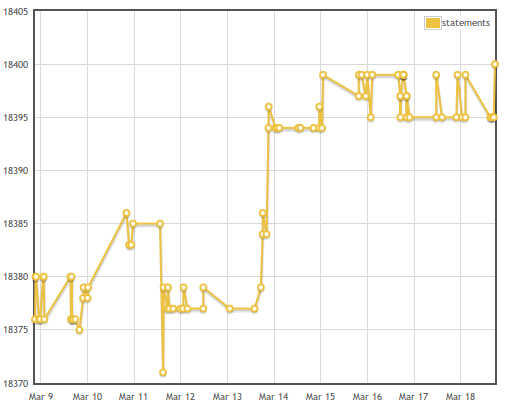
Yesterday I had a little quick fun with apycot in the train, using the existing plots infrastructure I managed to quickly add a few graphs to the application. I only had an old dump of our apycot for mercurial (http://apycot.hg-scm.org/) so the timespan is not huge, but I like it anyway! Here are some dev screenshots while you wait for this feature your your application... The pylint grades where pretty constant so I'm not including that graph.
Now, I have to make solid code and integrate it properly.
